Reporting Automation
Transform repetitive weekly and monthly reporting into a structured system that takes less effort to maintain.
Save reporting timeReduce manual workStandardize KPIs
Reporting automation · Power BI · Business intelligence
I help businesses turn recurring spreadsheets and raw data into automated, interactive dashboards—so leaders can see what matters and make better decisions faster.
The problem
When reporting depends on copying, reconciling, and rebuilding charts, your team spends its energy preparing information instead of using it.
The transformation
Your data is connected, cleaned, organized, and translated into consistent KPIs—giving management one interactive view that updates with minimal effort.
Services
Not charts for chart’s sake. Each solution improves how information moves from source to decision.
Transform repetitive weekly and monthly reporting into a structured system that takes less effort to maintain.
Interactive management dashboards for sales, finance, inventory, customers, operations, HR, and recruiting.
Improve existing workflows with Power Query, pivot tables, advanced formulas, and dashboard design.
Turn raw, inconsistent data into a reliable foundation for analysis and reporting.
Identify the KPIs that matter and design a clearer, more efficient reporting approach.
Dashboard portfolio
Real portfolio projects focused on the problem, solution, and decisions—not only the visuals.
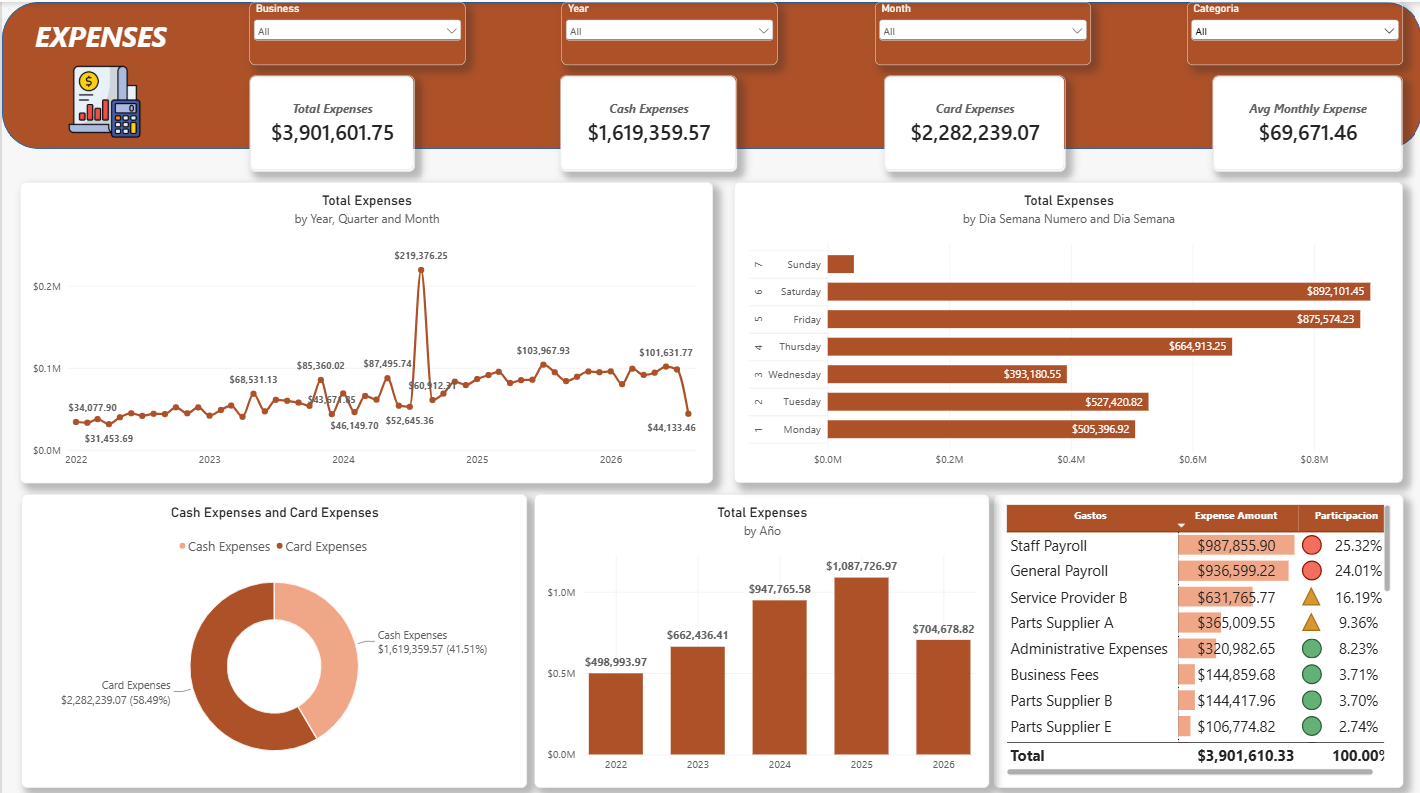 Finance
Expense data from multiple companies was stored in large Excel files, making analysis and comparisons difficult.
A centralized dashboard makes spending patterns visible and supports faster financial decisions.
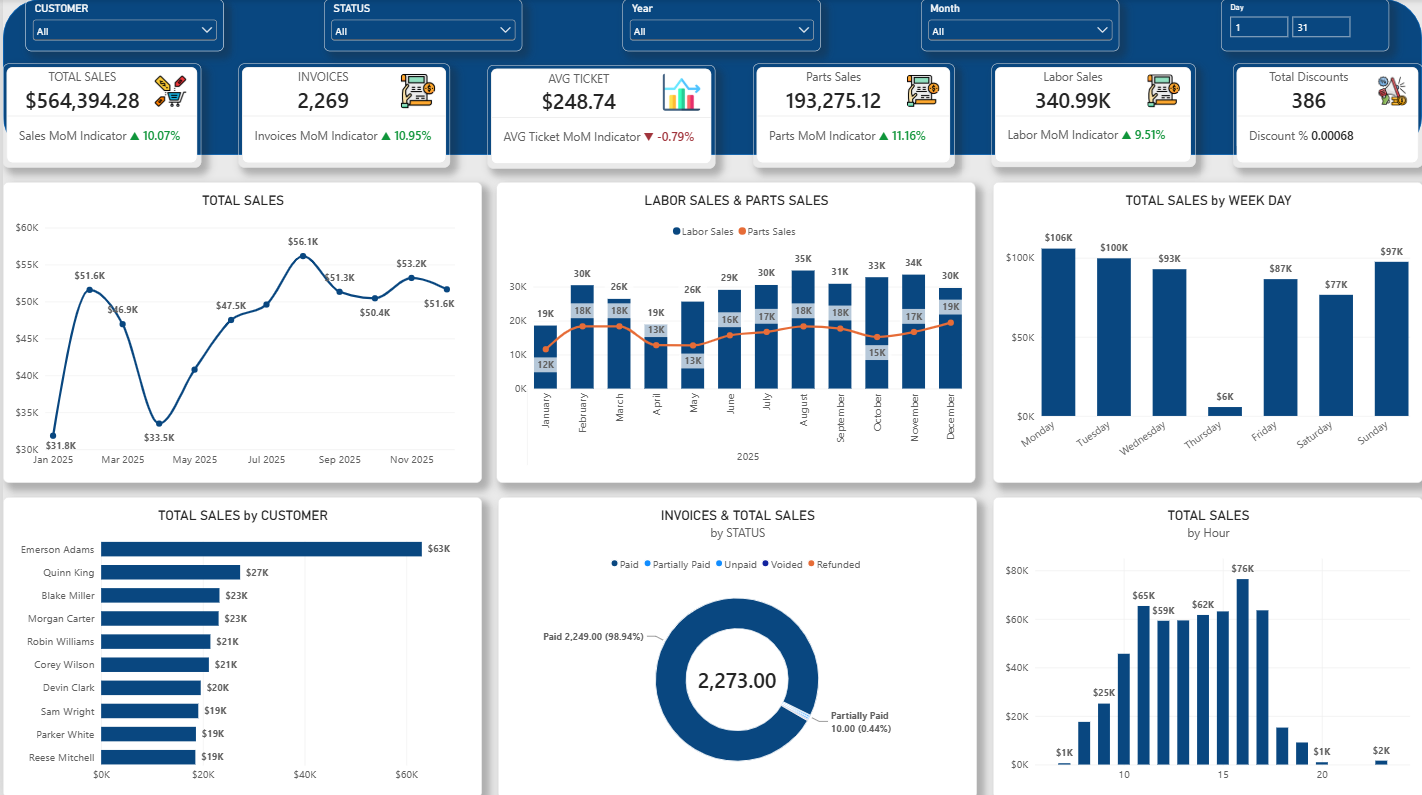 Sales
SalesManagement needed a faster way to monitor sales growth, customer value, discounts, and peak sales periods.
An interactive dashboard converts transactional data into clear KPIs, comparisons, and trends.
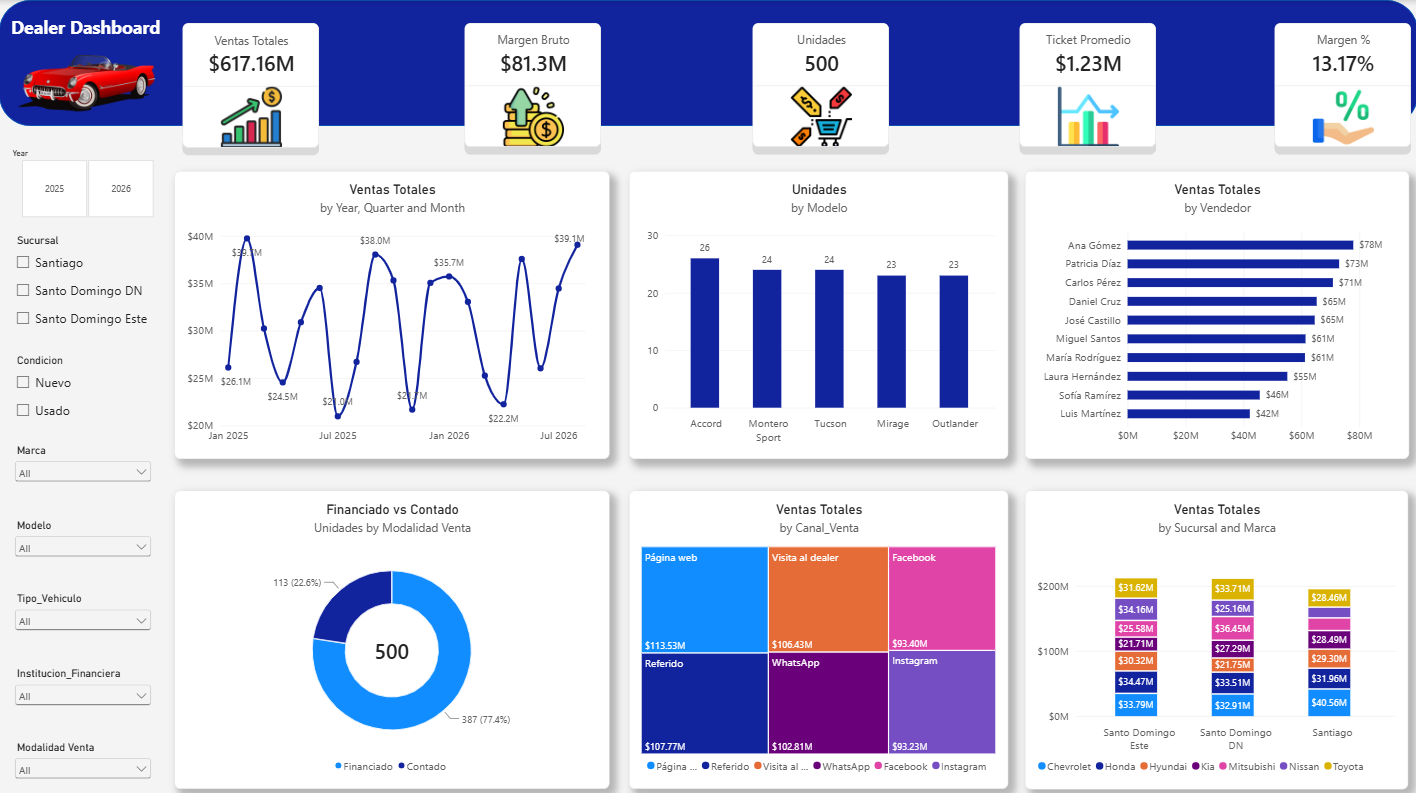 Sales
SalesDealership performance required manually reviewing spreadsheets across vehicles, salespeople, channels, and branches.
A centralized dashboard reveals revenue drivers and makes dealership performance easier to monitor.
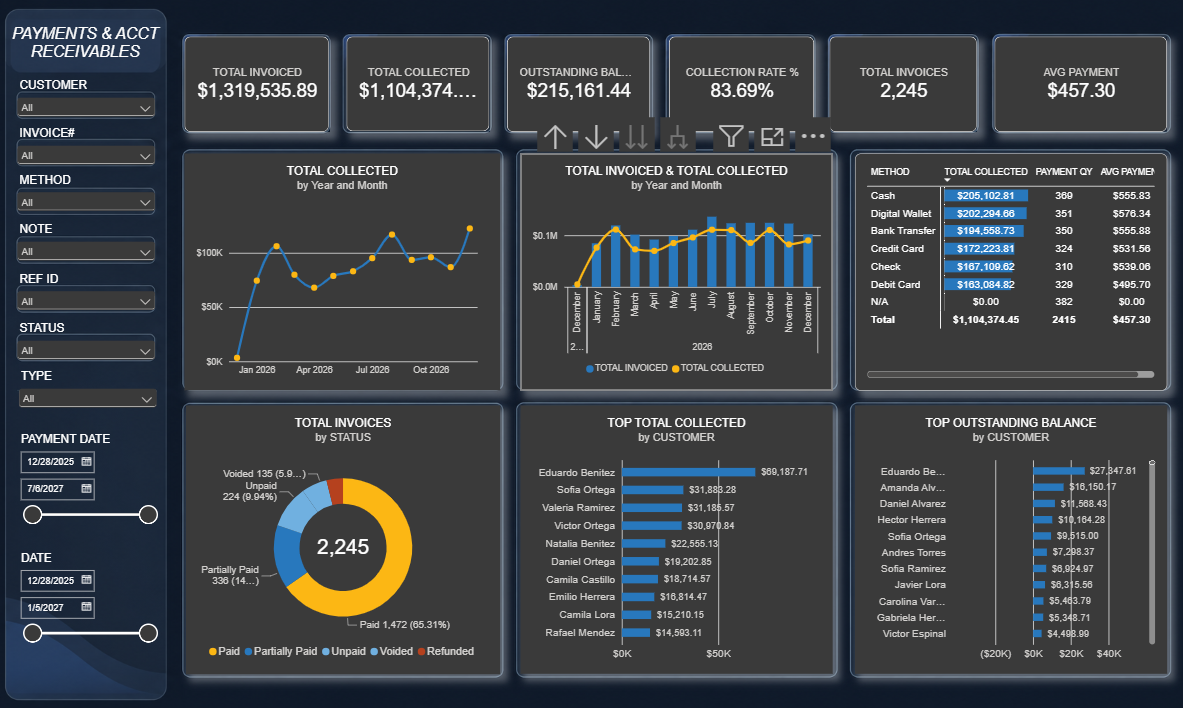 Finance
Multiple and partial payments tied to the same invoices made it difficult to track collections without duplicating invoice totals.
A centralized dashboard accurately connects invoices and payment transactions, giving the business clearer visibility into cash collections, receivables, and outstanding debt.
Client information is anonymized or modified where required.
About Elias
I’m a Data Analyst and Business Intelligence professional with more than six years of experience across analytics, reporting, automation, dashboards, and business research.
My work connects technical execution with business context: defining the right KPIs, structuring messy data, and delivering reports managers can use confidently.
Capabilities
• Power BI
• Tableau
• DAX
• Data visualization
• SQL
• Python
• Power Query
• Data cleaning
• Advanced Excel
• Power Automate
• Microsoft 365
• SharePoint
• Salesforce
• Odoo
• ChatGPT
• Claude
How I work
Map sources, manual tasks, frequency, and the KPIs management needs.
Clean, transform, and organize files, databases, and other sources.
Create an interactive view focused on important business questions.
Configure a repeatable workflow with minimal manual intervention.
Spend less time preparing reports. Spend more time using them.
Learn data with me
Educational content demonstrates both technical knowledge and the ability to explain it clearly.

Learn how NOMPROPIO and ESPACIOS can clean inconsistent names in seconds.
Watch on Instagram
Use Excel charts to reveal trends, compare results, and communicate insights clearly.
Watch on Instagram
Double-click the fill handle to complete thousands of rows without dragging formulas manually.
Watch on Instagram
Transform recurring Excel reports into interactive Power BI dashboards that reduce manual work, centralize KPIs, reveal trends, and support faster business decisions.
Watch on Instagram
Use Power Query to remove blanks and duplicates, standardize text, correct data types, and create a repeatable cleaning process that refreshes automatically when new data arrives.
Watch on Instagram
Calculate percentage growth between periods in Excel to compare performance, identify sales trends, and quickly spot declines.
Watch on InstagramFor recruiters
Open to Data Analyst, Business Intelligence, Reporting, and Power BI opportunities.
If your team is repeatedly exporting data, updating spreadsheets, and rebuilding charts, there may be an opportunity to automate it.
Let’s automate your reportingStart a conversation
Tell me how your team prepares reports today. I’ll help identify where automation can reduce effort and improve visibility.
eliasjimenez0024@gmail.com+1 849-359-2837Santo Domingo, Dominican Republic · Available remotely